Changelog: Postseason Bracket, ABS Rankings & Umpires
A lot landed between the July changelog and the first week of October. Most of it is aimed at the stretch run and the postseason: who’s in, who’s winning their series, and who’s calling the zone. It also adds a few new pages for digging into numbers.
Postseason bracket
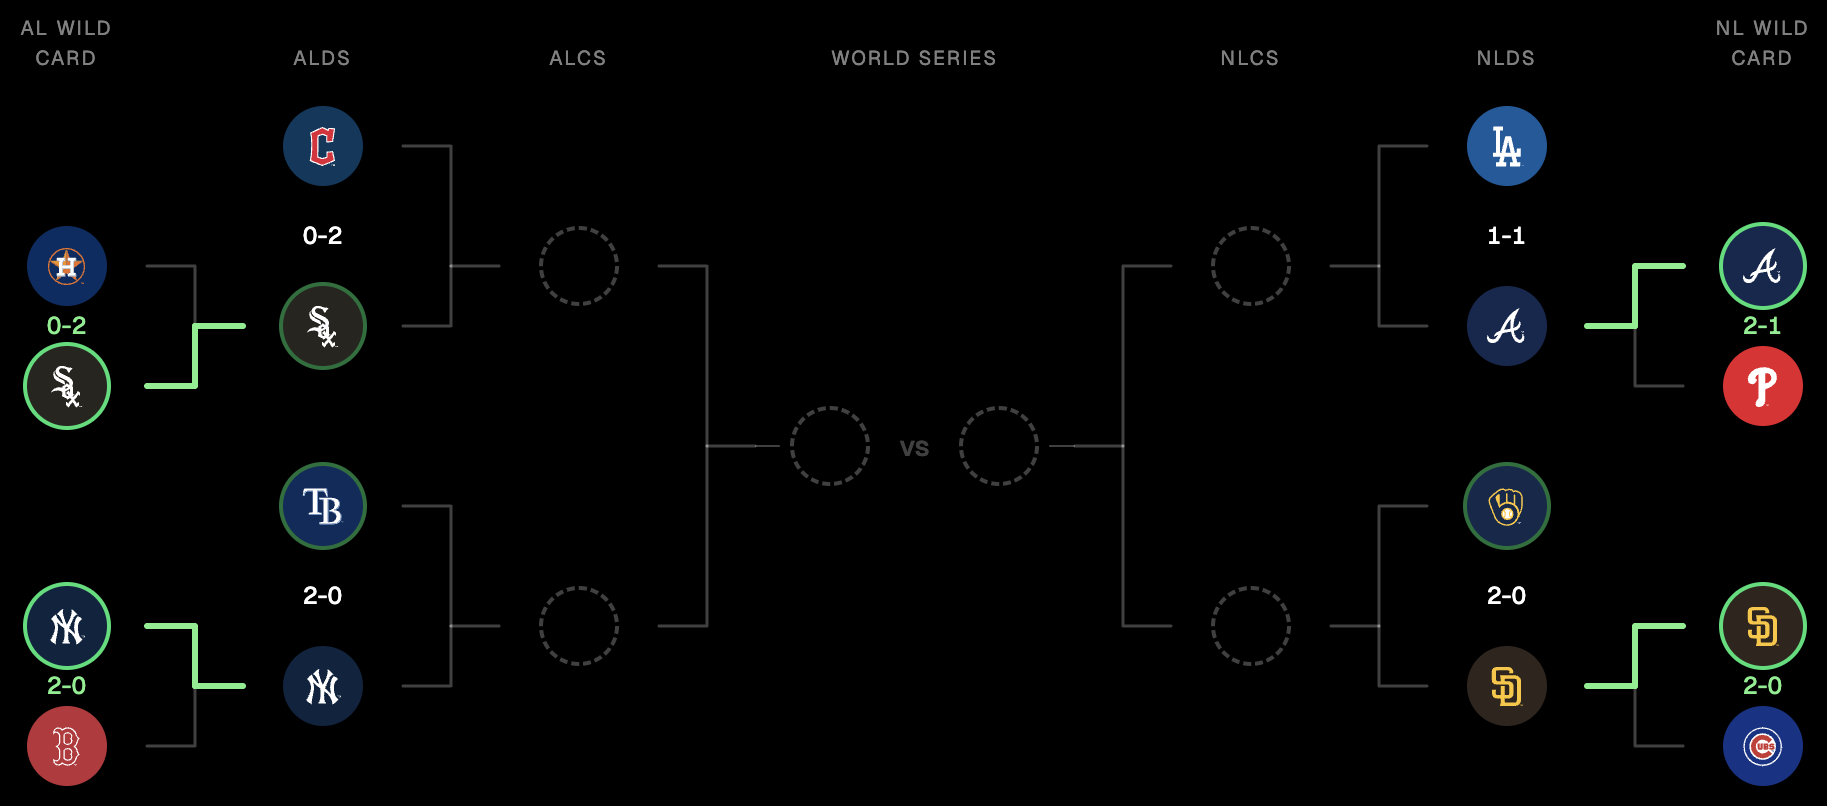
There’s a new Postseason page with the full bracket. It shows series scores and lines that light up as teams advance. A team leading a series that’s still going gets a soft green ring. A team that won its series gets a solid one. Before October, the bracket fills in from the current standings so you can see the matchups taking shape.
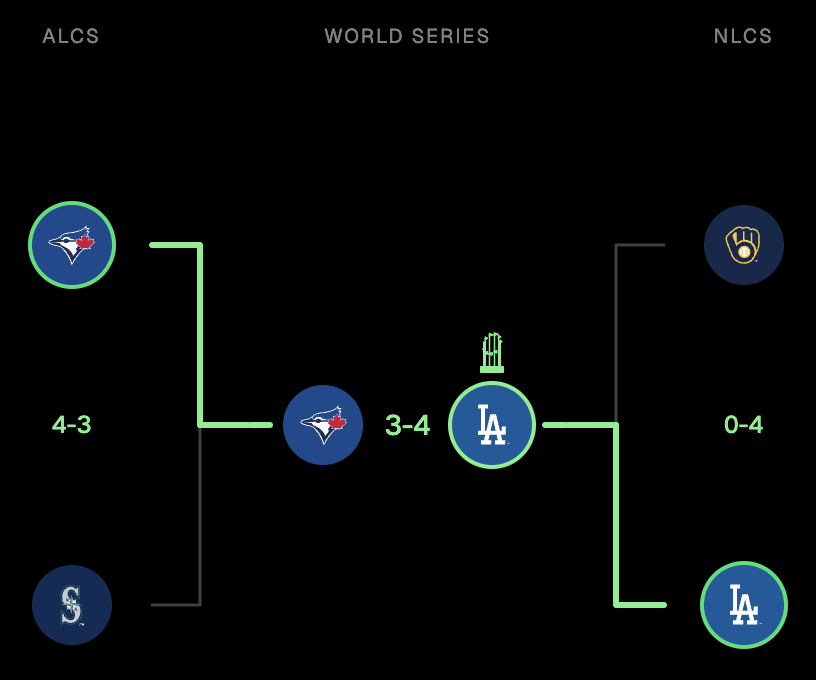
Once the World Series is decided, the champion gets the Commissioner’s Trophy above its logo, like the Dodgers on the 2025 bracket.
Playoff picture
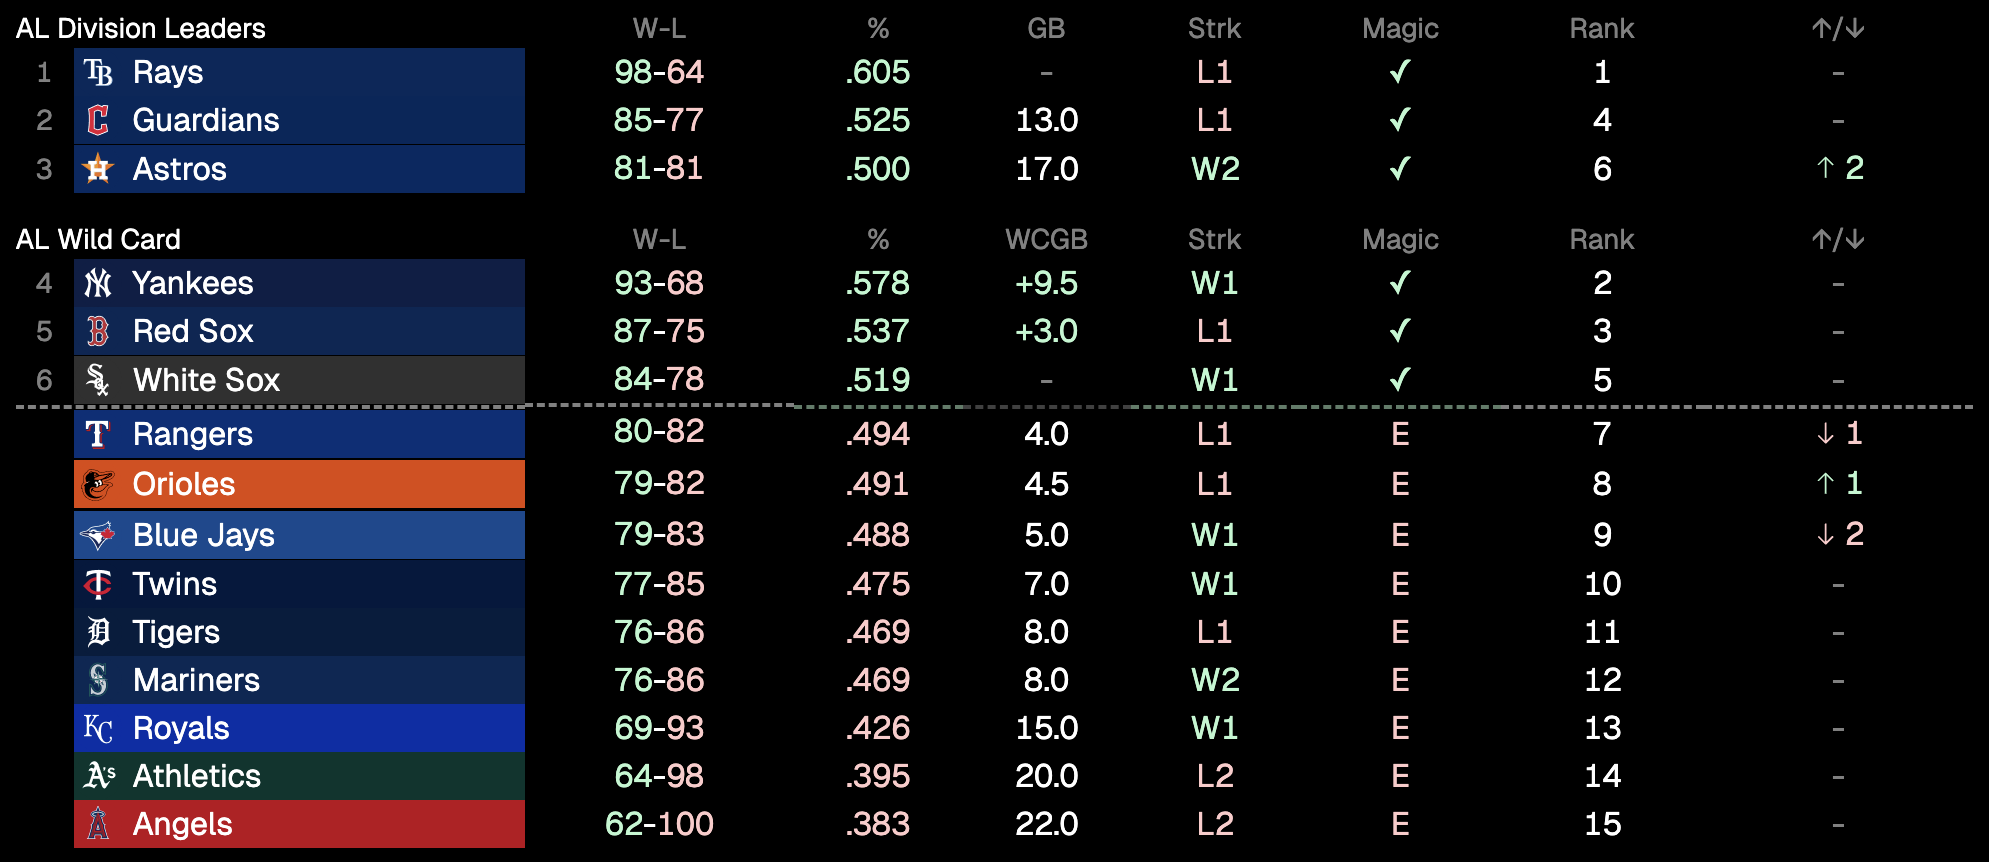
Set Standings to Postseason and you get the playoff picture: each league’s division leaders, the wild card race with a cut line, and a link straight to the bracket. There’s also an MLB option that ranks all 30 teams together.
The standings tables also picked up a few columns: Magic numbers (with a check once a team clinches) and ↑/↓ for how far a team moved in the last week. Divisions now stack vertically, too. A team only gets an E once it’s out of both its division and the wild card race.
See it on Standings.
ABS challenge rankings
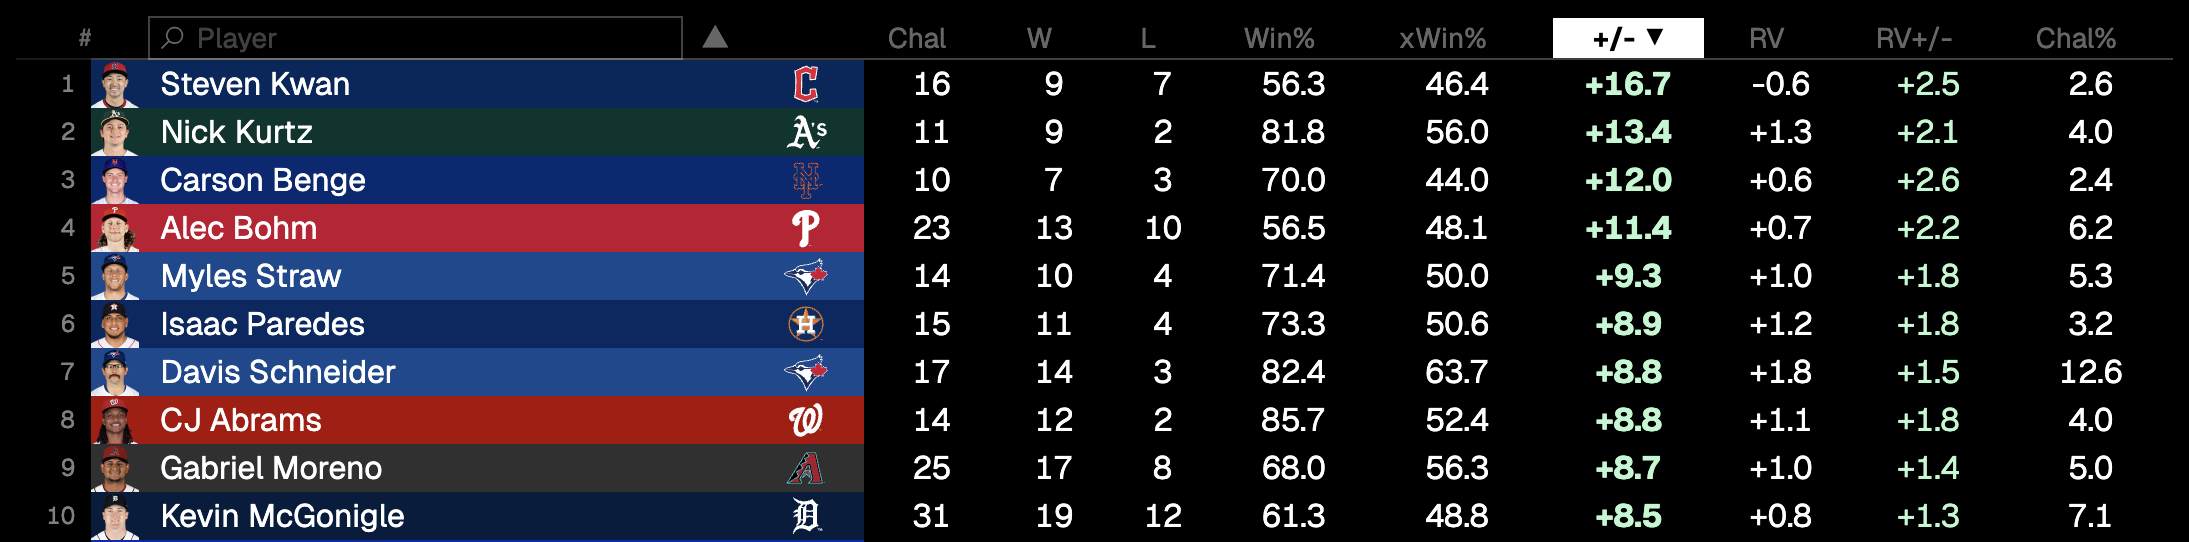
ABS Challenges has its own page now, ranking every batter, catcher, and pitcher by how their challenges have gone: wins and losses, overturn rate against expected, and run value. Filter by team, search a player from the Player column header, and the header row stays pinned while you scroll.
Umpires
Game pages now end with an Umpires section: the full crew plus a scorecard for the home plate umpire once the game is final. It shows accuracy (colored from red at 75% to green at 100%), accuracy against expected, missed strikes and balls, consistency, which team the misses favored, and how ABS challenges went. The small zone plot shows each miss, with missed strikes in yellow and missed balls in green.
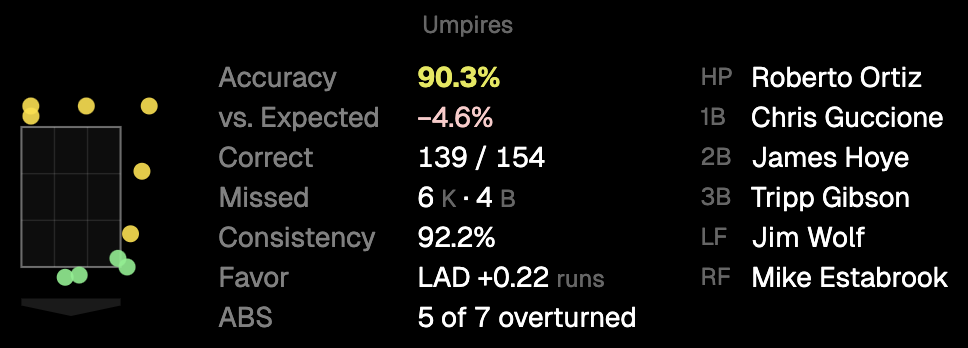
See it on Braves @ Dodgers, Game 1 of the NLDS.
Pitch arsenal
Pitcher pages now have a Pitch arsenal table: usage, average velocity with its range, and induced vertical and horizontal break for every pitch type, with a season picker that goes back to 2008.
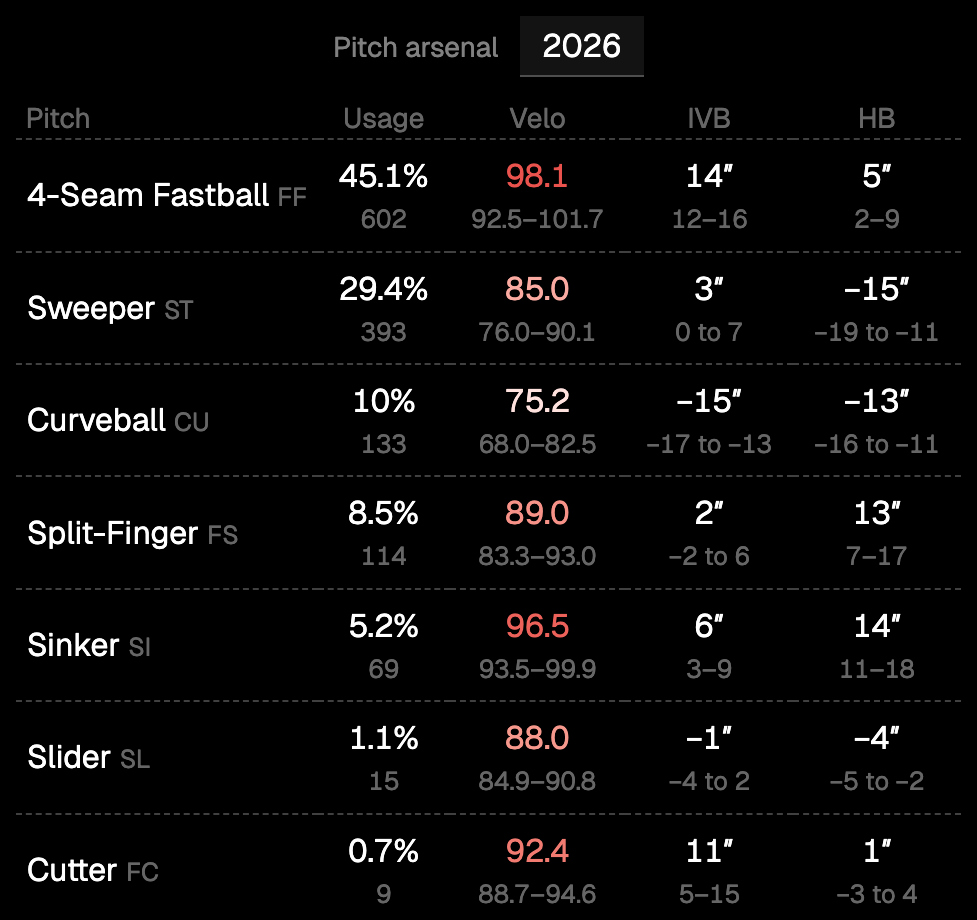
Ohtani is a fun one to look at. Season splits also gained an AB column for hitters and a G column for pitchers.
Team stats
Team Stats ranks all 30 clubs in hitting and pitching. Pick a month to see who’s hot right now rather than who’s been good all year.
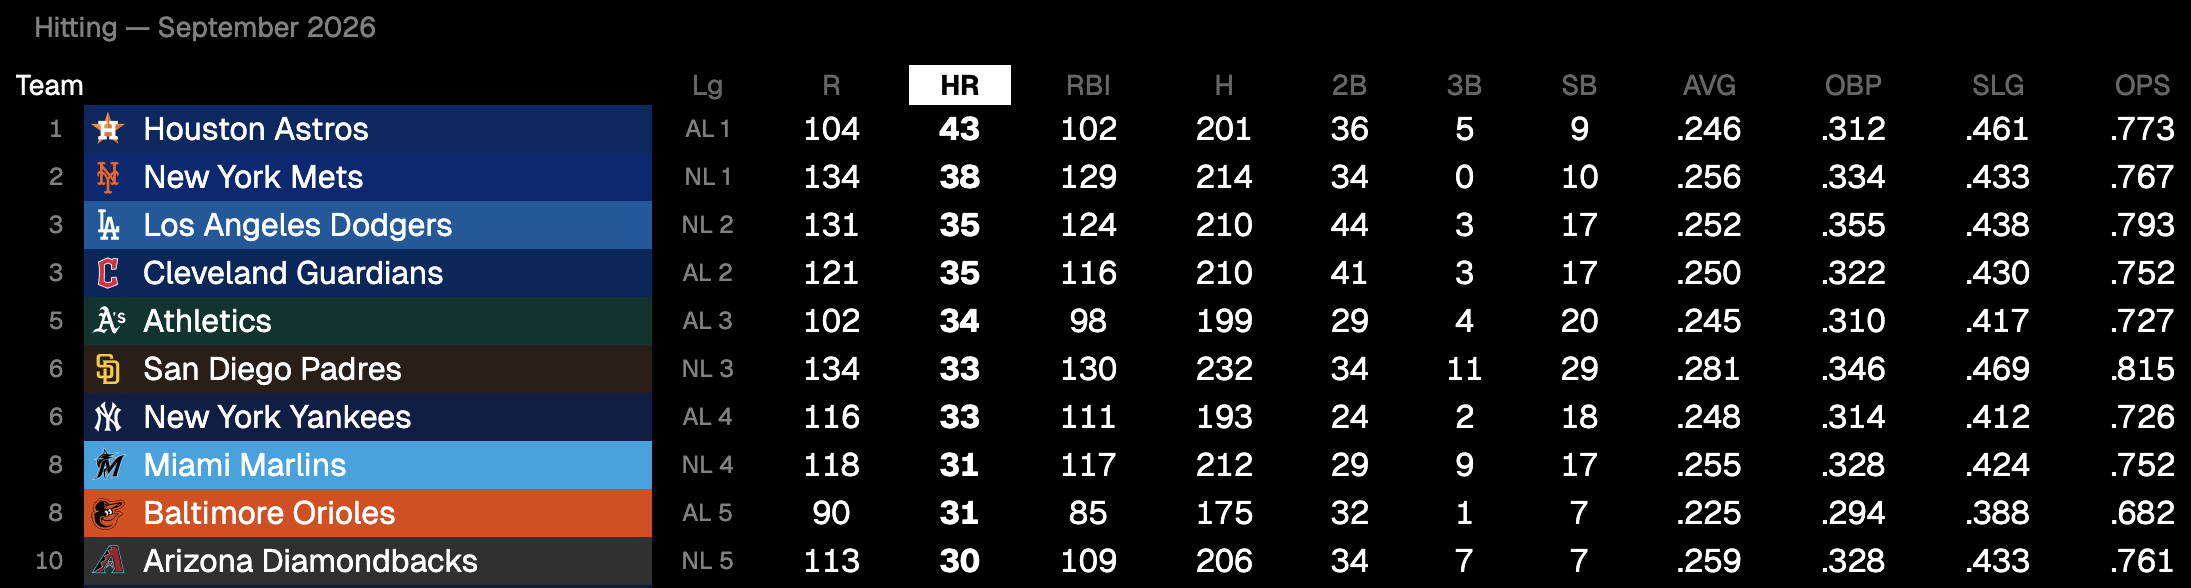
Longest home runs
Stat Leaders now ends with the season’s 20 longest home runs: distance, exit velocity, launch angle, date, opponent, and who gave it up.
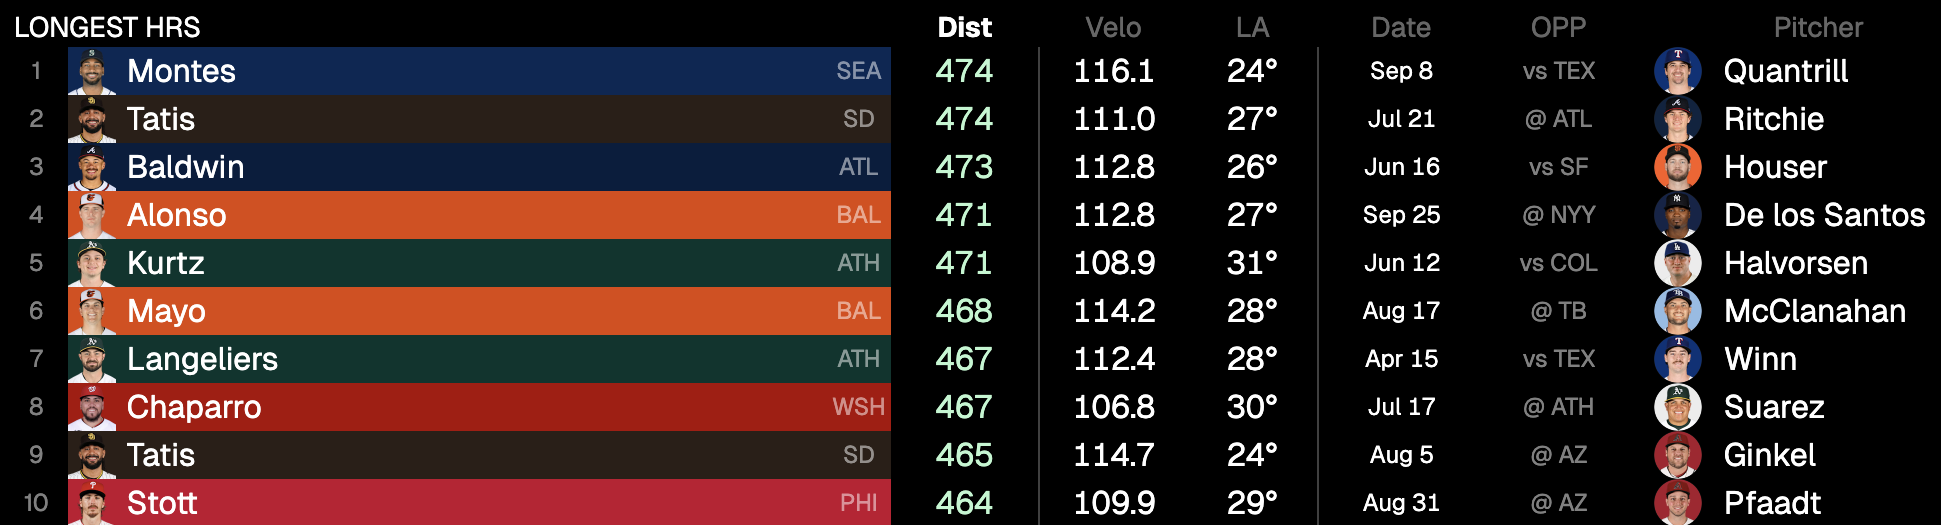
Injured list
Team pages have an Injured List section: IL type, position, the injury, and the earliest date each player can come back. It’s limited to big leaguers, so minor-league stints don’t clutter it.

See it on any team page, e.g. the Dodgers.
Your team on the homepage
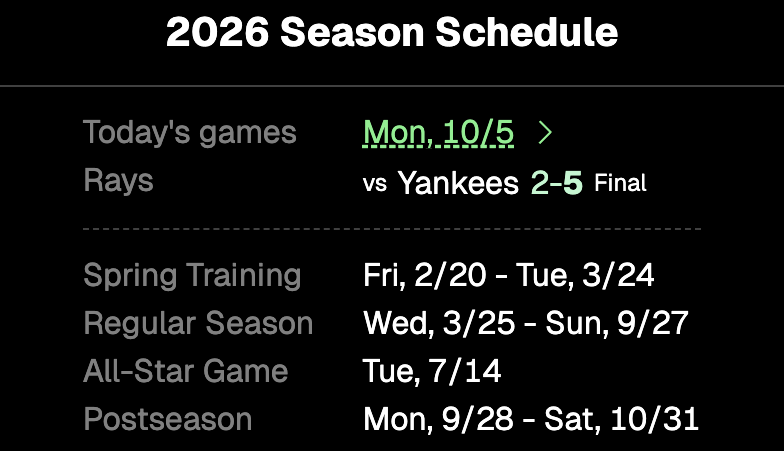
If you’ve favorited a team, the homepage season card now shows its game today, with the score or first pitch time.
Smaller things
- Live games show the baserunners’ headshots on the bases.
- Games streaming on Apple TV get the Apple TV logo.
- The at-bat sequence draws home plate under the zone, shows home run distance, and opens at the first at-bat for final games. Picking a play in the plays list jumps the at-bat sequence to it.
- The plays list colors hits and other balls in play that didn’t record an out blue.
- Hot/cold zones use a flat home plate to match.
That’s the haul for now. Use the app, poke around, and tell me if something feels off or missing.