Changelog: Time Travel, Scorecards & Pitch Flights
The World Series is over (congrats, Brewers), but the app kept busy all October. Most of this round is about watching a game: keeping the page in sync with your TV, seeing each pitch the way the camera sees it, and scoring the game like you would in the stands. After that come player pages, getting around faster, and a homepage baseball you can play with.
Time travel: sync to your stream
Streams and TV run behind live, so the app can spoil a home run before you see it. Game pages now have a delay row under the linescore. Pick the pitch your stream is showing and the whole page (scorebug, plays, win probability, box score) stays that far behind live.
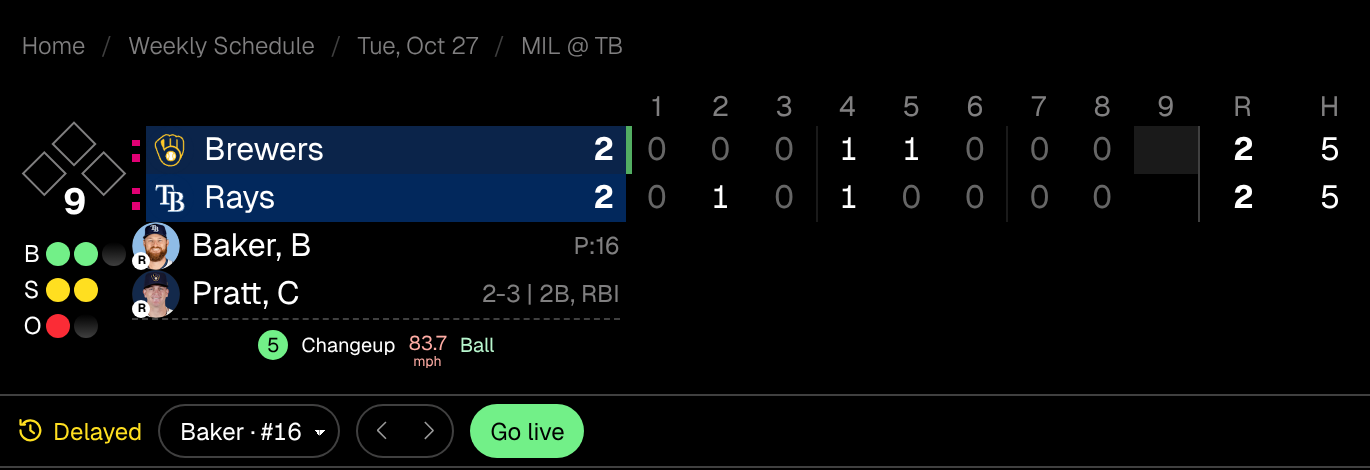
- ‹ › step one pitch back or forward, and ±3s fine-tunes the sync on live games.
- The delay is saved per game. Leave the page and come back, or open it in a new tab, and you land on the same pitch instead of jumping to live.
- Schedules show your delayed version of the game too, with a yellow Delayed tag, so a score card on the schedule can’t spoil it either.
- On a live game, highlights are covered while you’re behind, since clips can’t be rewound.
- It works on finished games too, so you can replay one pitch by pitch.
Try it on World Series Game 4: pick a pitch from the 9th inning and play it forward to the 12th.
Pitch flights, in 3D
The pitch sequence panel looks a lot more like a broadcast now. Each pitch is drawn along its real flight path using Statcast’s trajectory data, from release to the plate, as seen from a camera behind home. The ball starts small and high and grows as it reaches the zone.
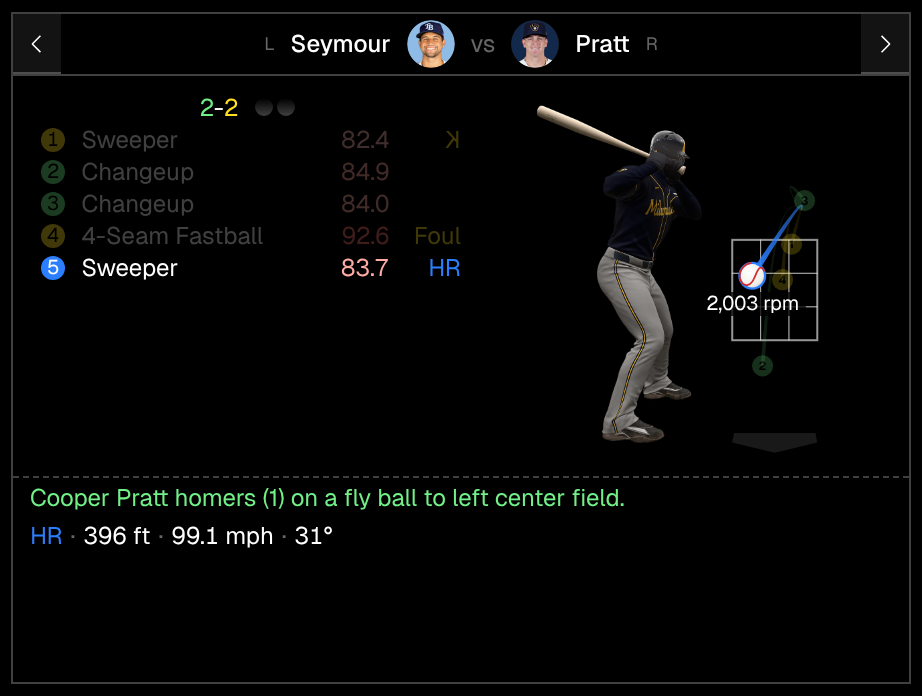
- The batter stands in his team’s uniform for that game, scaled so the strike zone lines up with his body the way the rulebook defines it (shoulders to knees).
- Tap a pitch to pin it. Its marker turns into a baseball that flies in at its own speed and spins on its real spin axis, with the rpm underneath.
- The pitch list now shows each pitch’s outcome next to its speed: K (backwards when called), Foul, Ball, HR, and so on.
- A pitch that was ABS-challenged shows the original call peeking out behind its number.
That’s Pratt’s go-ahead homer in the 12th of Game 4.
Scorecard
The box score has a new Scorecard tab. Every plate appearance gets a diamond like a paper scorecard, with consistent colors:
- Red means an out. Blue means a run scored, and the diamond fills in when that batter came around to score.
- Green base paths for walks, white for reaching on an error, dashed lines for stolen bases, and red for caught stealing or a pickoff.
- Sacrifices read like any other play (F8, 1-3), and substitutes get an arrow in their own row.
- Diamonds outside a player’s time in the game fade out, so you can see when each sub was in.
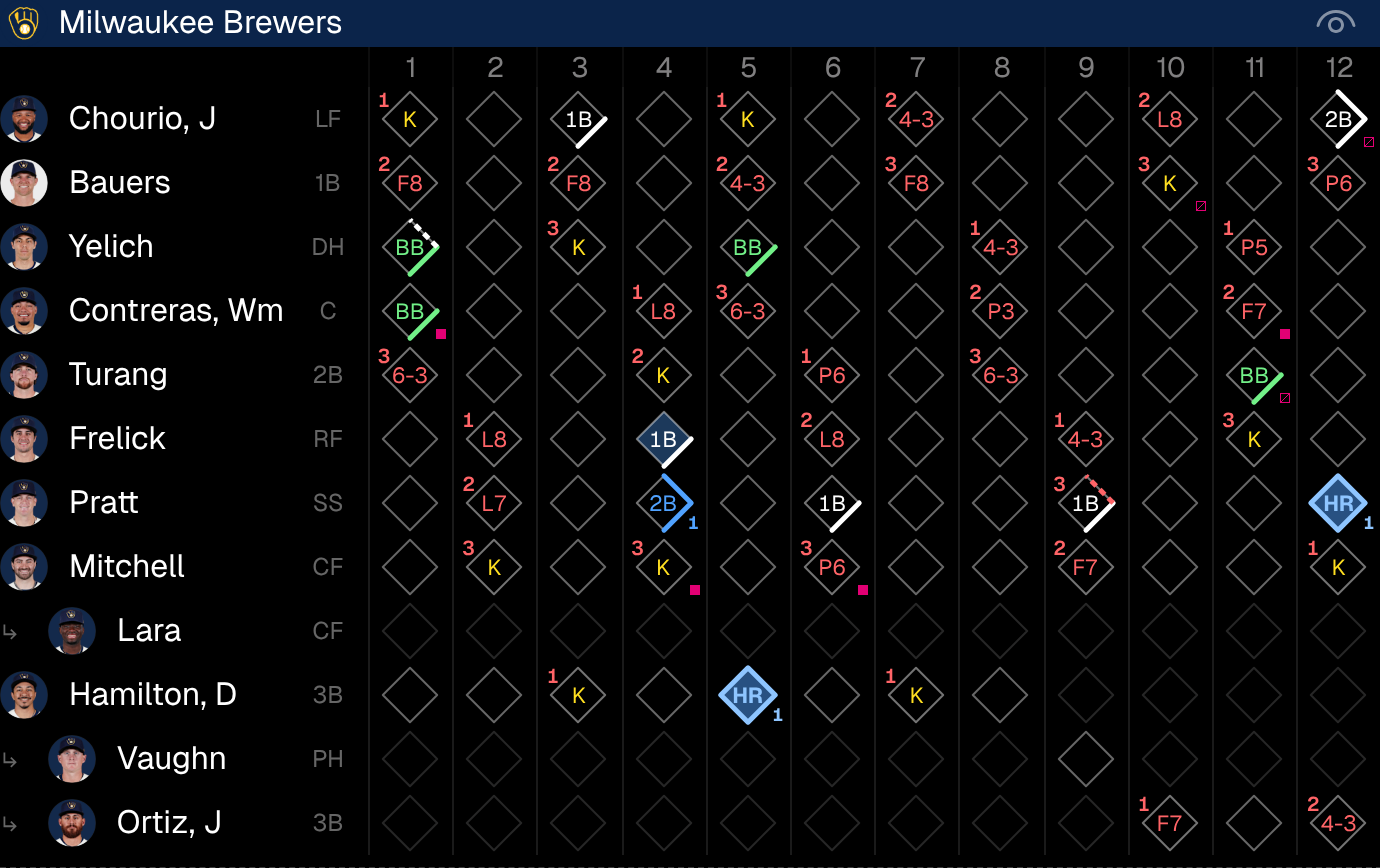
ABS challenges show up as small pink squares: filled when the call was overturned, crossed out when it stood. The away team’s go in the top corner and the home team’s in the bottom. Hover or tap a cell for the play and challenge details, and click it to open that at-bat in the pitch sequence.
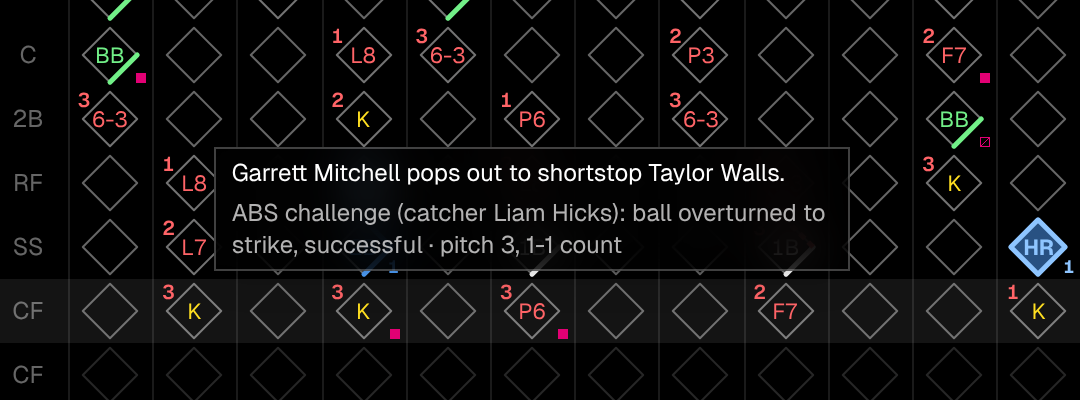
Game 4 had 11 challenges, so it’s a good one to look through.
Home run chart
Each home run path now ends in the batter’s headshot, in a ring of his team’s color. Pick one and it gets bigger and sharper, with distance, exit velocity, launch angle, and the pitch it came off. The list shows each player’s season count, like Mitchell (#1), and the outfield walls are now straight lines between the park’s posted distances instead of a smooth curve.
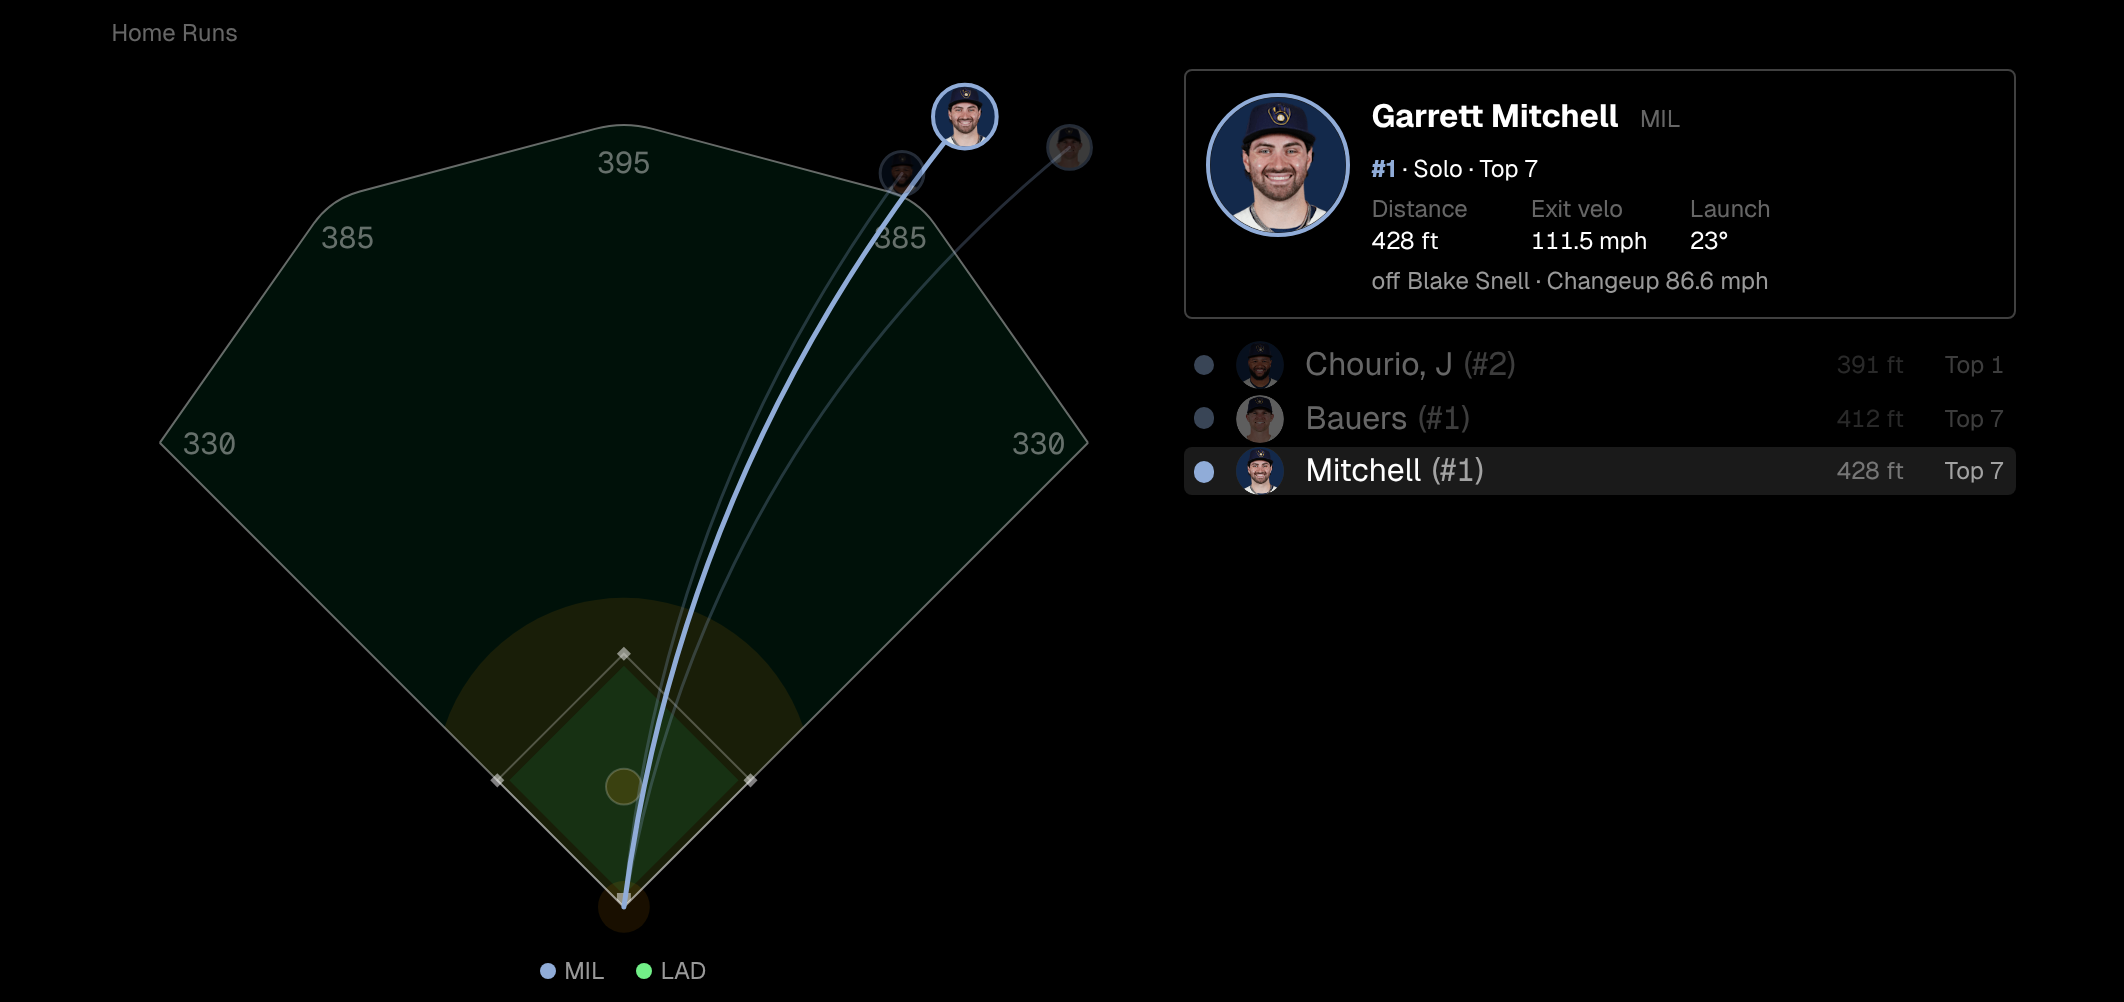
See it on Brewers @ Dodgers, NLCS Game 3. The box score also moved up, ahead of Top Performers and Home Runs.
Section navs
Long pages got a floating section nav at the bottom: one icon per section, the current one highlighted as you scroll. It tucks away while you scroll down and comes back when you scroll up or pause.
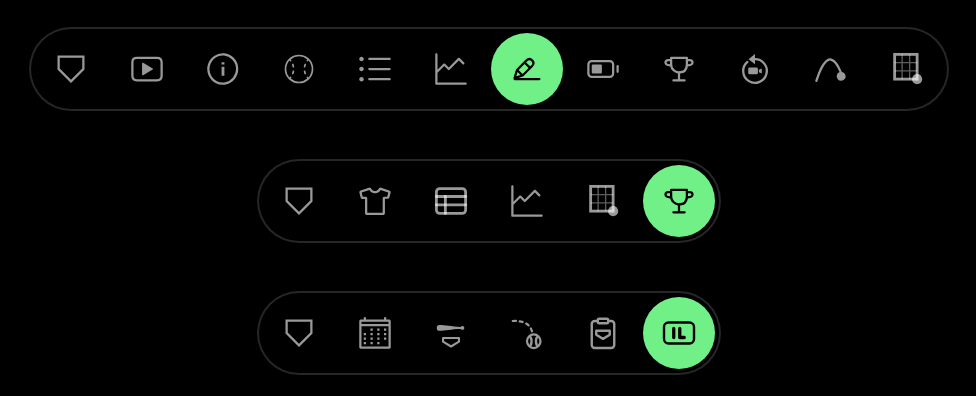
- Game: pitch sequence, plays, win probability, highlights, info, box score, bullpen, top performers, reviews, home runs, umpires.
- Player: teams, season stats, pitch arsenal, year-by-year, hot/cold zones, awards.
- Team: series calendar, batters, pitchers, coaches, injured list.
The first button always takes you back to the top.
Player pages
Awards
Player pages end with an Awards table: every award by season, in team colors, with repeat awards numbered. AL and NL versions count together, so Ohtani’s 2025 NL MVP shows as his #4. MVPs and Cy Youngs are highlighted in green.
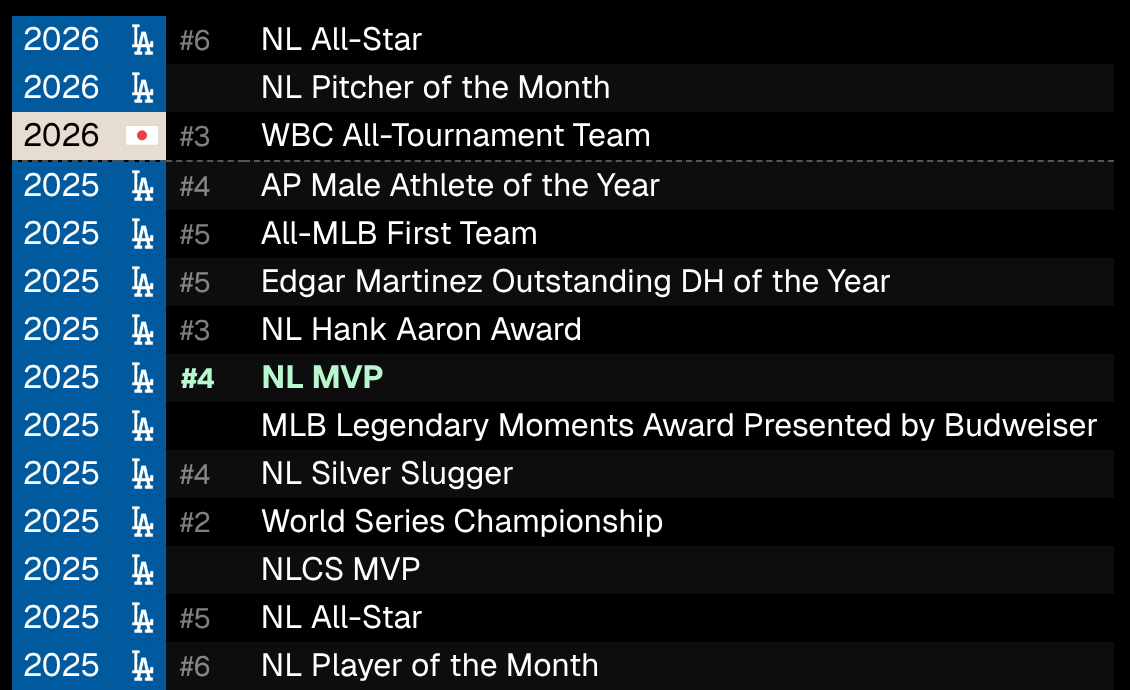
See Ohtani.
More on the profile
- A scrollable row of headshots from every season sits under the team history, including coaches’ and managers’ later years.
- MLB Debut now links to the debut game itself.
- Retired and inactive players show their last played date.
- The Players directory’s popular players get bigger, sharper headshots.
Pill switchers
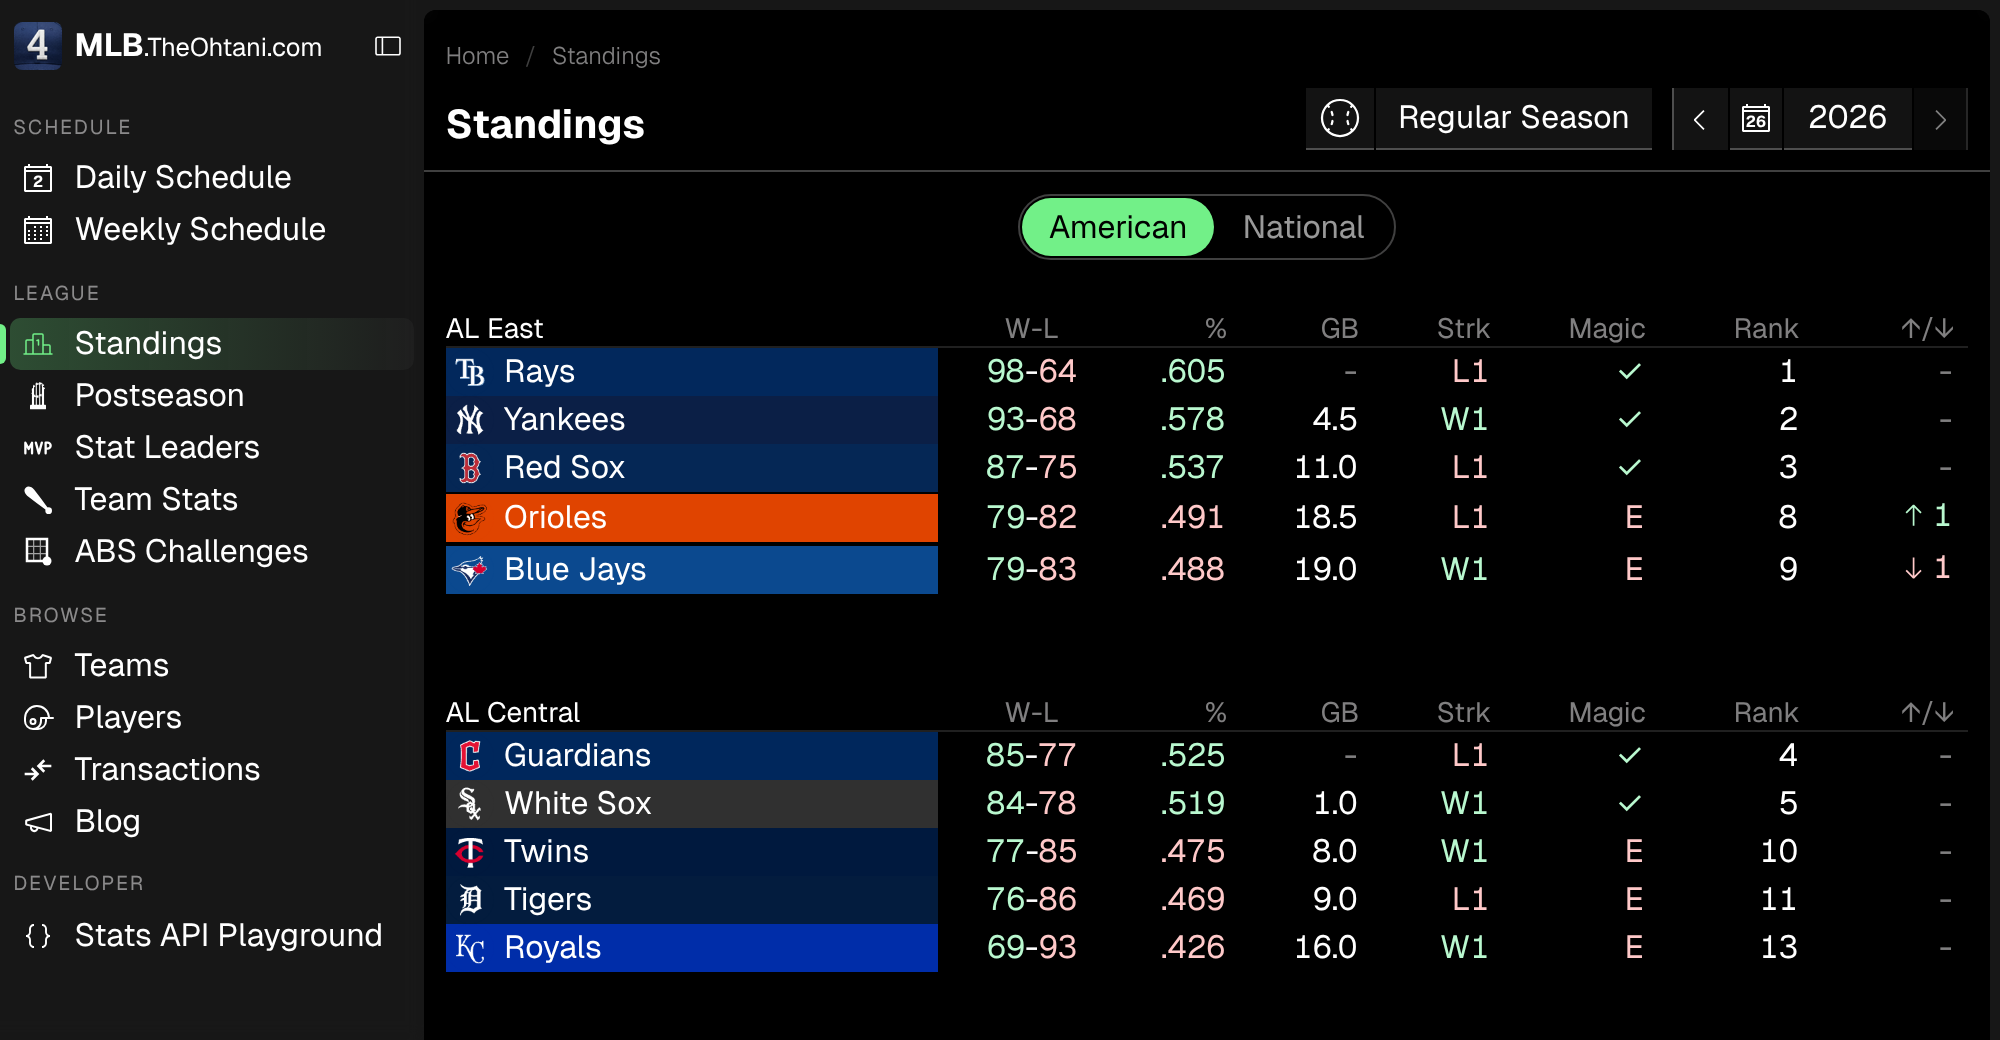
The sliding pill from the box score tabs is now used across the app, so big pages show one table at a time:
- Standings: American or National.
- Team Stats and player pages: Hitting or Pitching (pitchers open on Pitching).
- Stat Leaders: Hitting, Pitching, or Longest HRs, which is now its own tab.
The sidebar matches: the current page gets a green pill and edge bar that glides to the new link when you navigate.
One more thing: the homepage baseball
The ASCII baseball on the homepage is now a real ball: two matching covers, red V-shaped stitches, and believable spin physics. Drag it to spin it, fling it to keep it spinning, and watch air drag slow it back down.
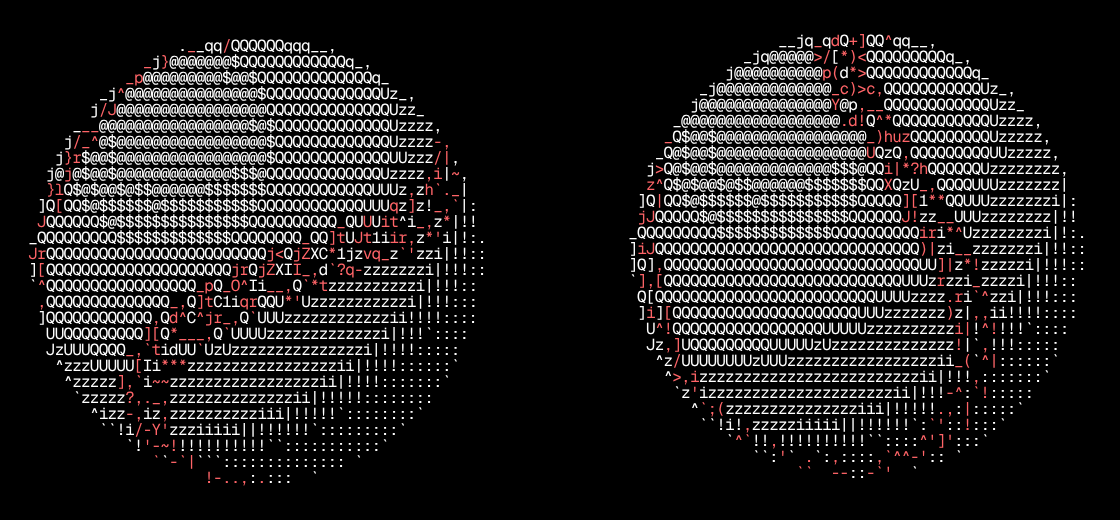
The MLB banner above it now appears in a scrambling wave of green characters. Tap it to play the animation again.

Smaller things
- The all-plays list shows the batter’s headshot and the ball-strike-out count next to the bases.
- The pitcher box score has B and S columns for balls and strikes.
- The scorebug’s Next up card shows who’s actually due up while a batter is at the plate, instead of repeating him.
- Clicking a review jumps the pitch sequence to that at-bat.
- Bullpen fatigue now counts postseason outings.
- Team pages can show a past date with
?date=: the roster, series calendar, and injured list as of that day. The month picker sets it. - Expandable sections animate open and closed.
- Win probability team labels are centered in their halves.
- Fixed: the Add to Home Screen icon falling back to a letter on iOS, the app shifting after rotating a phone, and a crash on some older game pages.
Under the hood
Every table (standings, stats, box scores, scorecards, rosters, and more) now runs on one shared table component built on TanStack Table, with sticky headshots and team colors when you scroll sideways. Analytics only run on the production site, and the version number at the bottom of the sidebar now goes up with every commit.
That’s the haul for now. Use the app, poke around, and tell me if something feels off or missing.